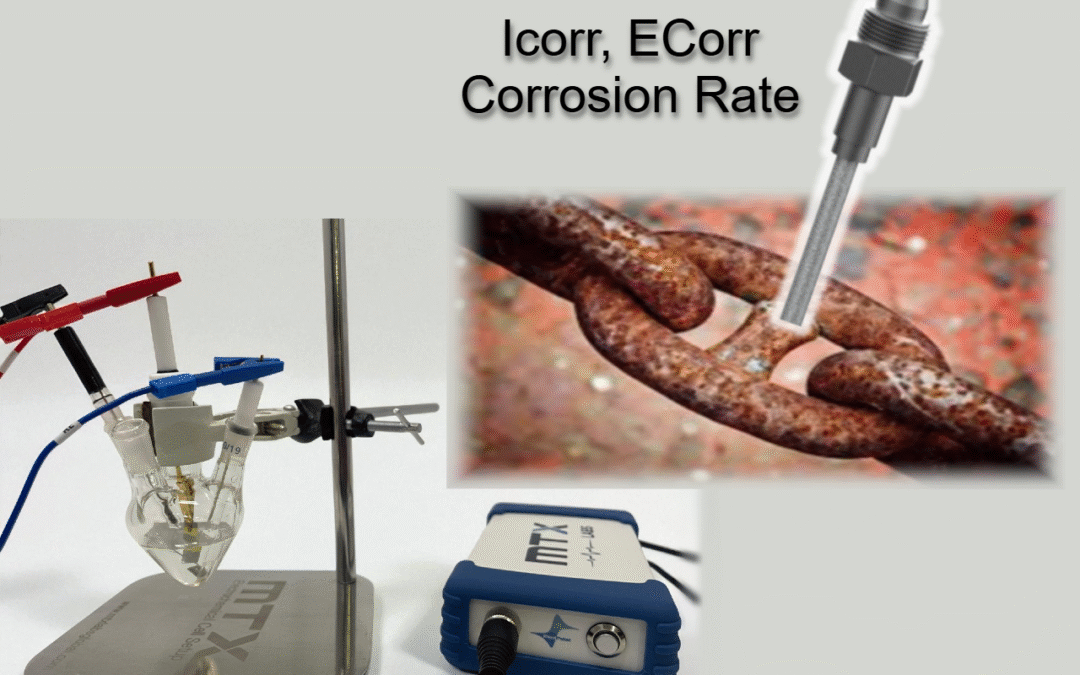
Corrosion rate measurement is critical for evaluating the durability of metals and protective coatings. Although there are various methods to estimate corrosion rate in different applications, the Electrochemical Corrosion Measurement is a widely adopted technique due to significantly faster & accurate results. In this application note, we demonstrate the implementation of the Tafel analysis experiment so that you can know how to calculate the corrosion rate with the help of corrosion potential (Ecorr) and corrosion current (icorr) using the portable hand-held electrochemical analyzer MedPstat. This procedure highlights how to configure experimental parameters in the MedPstat software, how to acquire high-quality polarization curves, and how to perform automated corrosion rate calculations directly within the software.
Introduction
Electrochemical methods have become indispensable in corrosion science and engineering, providing rapid, quantitative, and reliable assessment of material degradation processes. Among these techniques, Tafel analysis remains one of the most widely used approaches for determining corrosion rates and kinetic parameters. Traditionally, researchers perform linear sweep voltammetry (LSV) experiments, export the resulting polarization data, and manually fit the curves to extract anodic and cathodic slopes—a process that can be time-consuming and prone to user variation.
The MedPstat electrochemical workstation streamlines this workflow with an integrated Tafel analysis module designed for efficient and precise corrosion testing.
This feature enables users to:
-
Run polarization scans with optimized experimental settings
-
Automatically identify Tafel regions for accurate slope fitting
-
Draw anodic and cathodic lines directly within the interface
-
Instantly calculate the corrosion rate and related kinetic parameters
-
Save test reports in
.txtformat—up to 10 at once—for easy data management and parameter recalculation (e.g., material density, exposed surface area, etc.)
With this automated analysis capability, the MedPstat electrochemical workstation enhances productivity and reproducibility in electrochemical corrosion evaluation.
Experimental Setup
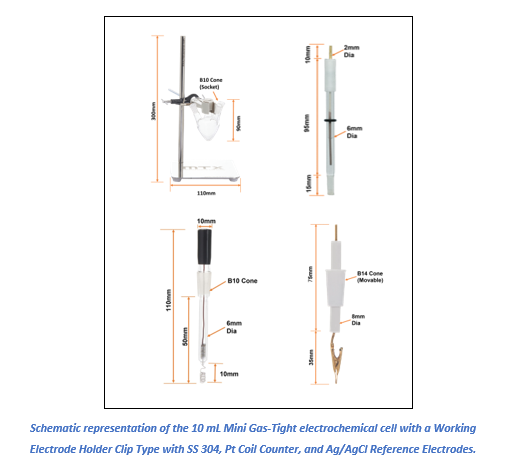
Electrochemical measurements were conducted using the MedPstat 2.0 Electrochemical Analyzer (MTX Labs). A three-electrode configuration was employed, with a 5 mm × 5 mm stainless steel (SS304) working electrode held using the MTX Labs Clip-Type Electrode Holder, a Platinum Coil counter electrode, and a Mini Ag/AgCl reference electrode. Experiments were performed in a 10 mL Minii Gas-Tight Conical electrochemical cell (MTX Labs) designed to minimize contamination and solution loss. The corrosive medium consisted of 3.5% saline solution prepared in deionized water, with a total electrolyte volume of 15 mL used for each test
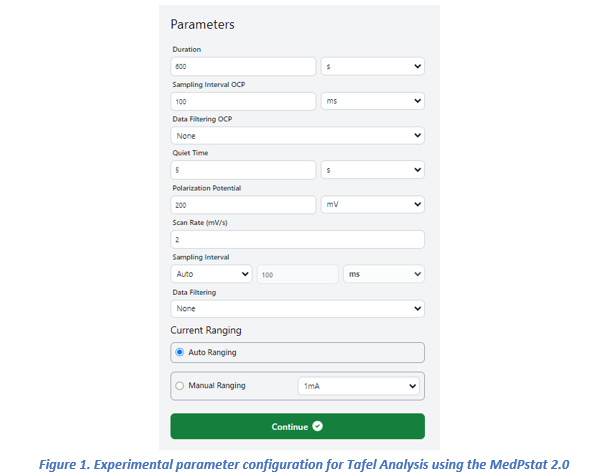
Parameter:
Data Acquisition and Analysis
- Running the Experiment:
- The software automatically detects OCP.
- The polarization scan is initiated within the set potential window.
- The resulting curve shows both anodic and cathodic branches.
- Data Interpretation:
- The software fits linear regions of anodic and cathodic branches.
- Extrapolation provides Ecorr and icorr.
Results and Discussion
The corrosion study was performed using a 3.5% NaCl solution as the electrolyte, with the parameters configured as described above. The experiment began with the measurement of the Open-Circuit Potential (OCP), allowing the system to stabilize before polarization. While OCP measurements typically require a stabilization time of approximately 10 minutes, in this study, the sample was stabilized by running the OCP for 10 minutes prior to further measurements. As shown in Figure 2, the software automatically determined the OCP value, which was displayed in the plot window. Using this equilibrium potential as the reference, a potential window of ±250 mV was applied, and the polarization scan was executed. Upon completion, the MedPstat software confirmed successful data acquisition, generated the polarization curve, and automatically saved the experimental data in the results window for further analysis.
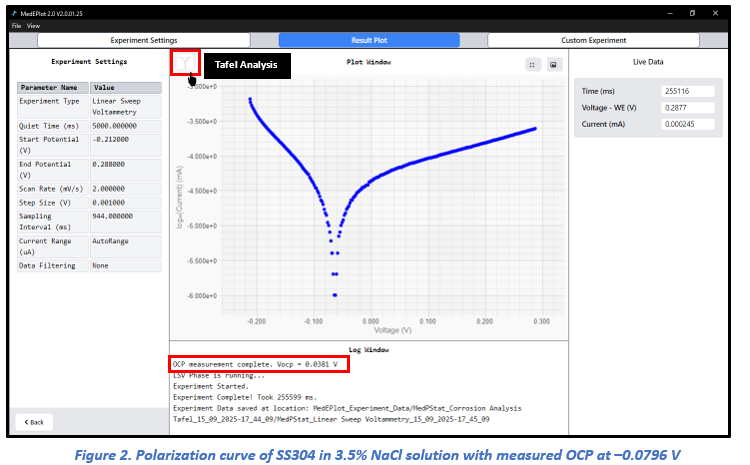
For further evaluation, the polarization curve was examined using the Tafel Analysis module in the MedPstat software. By selecting the Analysis tab at the top-left corner of the plot window (Figure 2), the software seamlessly transitions into a dedicated analysis interface (Figure 3). At this stage, an additional analysis panel appears on the right-hand side of the window, where the anodic and cathodic regions of the polarization curve can be manually defined by selecting the start and end points of each slope. This step enables precise identification of the linear Tafel regions required for subsequent fitting and parameter extraction
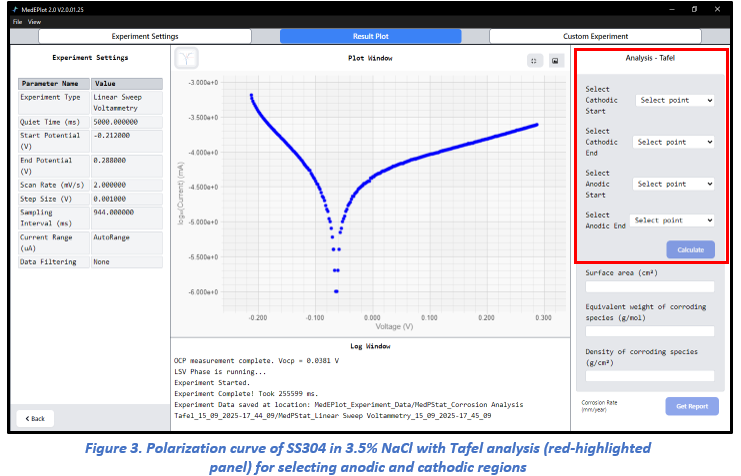
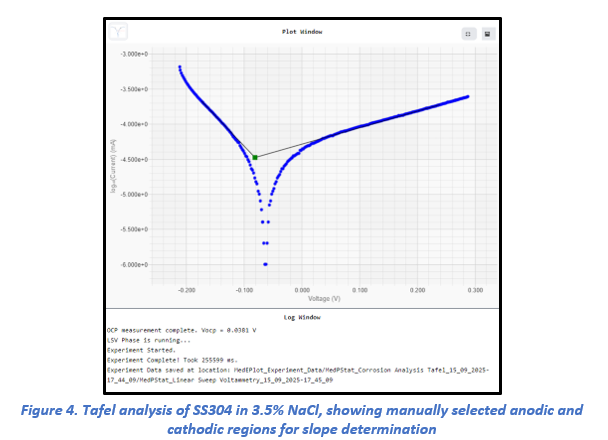
To perform the analysis, the user must select the cathodic start and end points, followed by the anodic start and end points. Once these regions are defined, the selected points are highlighted in red on the plot for clarity. By clicking the Calculate button, the software automatically fits straight lines through the chosen regions, connecting the red points with black slope lines. The intersection of the anodic and cathodic slopes is then marked in green, indicating the precise values of Ecorr and Icorr, as illustrated in Figure 4.
From these extrapolated lines, the software automatically determines the corrosion potential (Ecorr) and corrosion current (icorr), as shown in Figure 5. The calculated values are simultaneously displayed in the analysis panel on the right-hand side of the plot window (Figure 5), ensuring immediate access to accurate corrosion parameters. After obtaining Ecorr and icorr, the next step was the calculation of the corrosion rate.
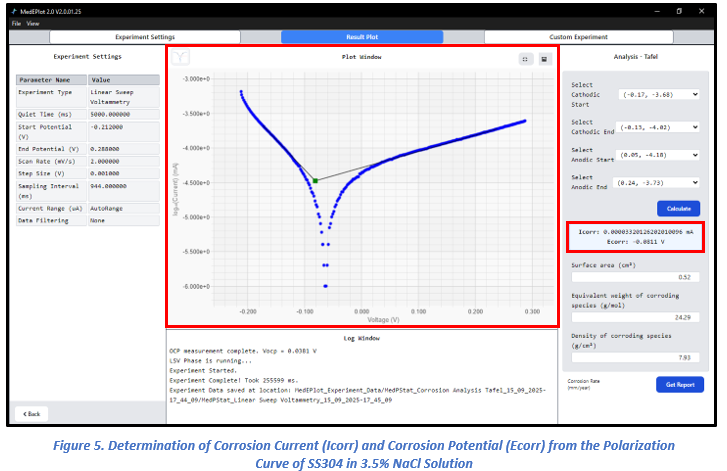
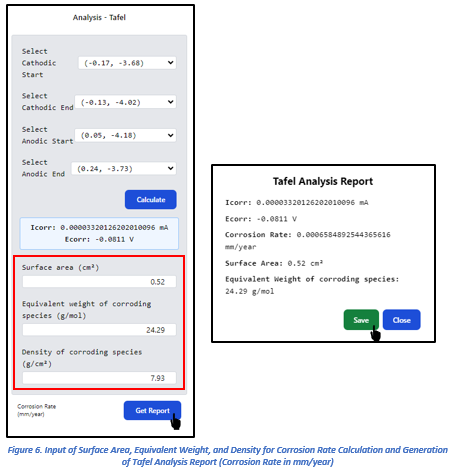
To calculate the corrosion rate, the surface area of the sample, along with the equivalent weight and density of the material, was entered into the software. Once these values were provided, the Get Report option was selected in the plot window (Figure 6). The MedPstat software then applied the standard corrosion rate equation and, with a single click, generated the corrosion rate along with the key electrochemical parameters (Ecorr, icorr, corrosion rate, surface area, and equivalent weight). These results were displayed in a dedicated pop-up window titled Tafel Analysis Report (Figure 6). By clicking Save, the complete report could be easily stored in .txt format for documentation and future analysis
Note: The MedPstat software also provides flexibility for recalculating corrosion rates with modified parameters. For example, in this study, the SS304 sample was initially considered with both sides exposed, giving a surface area of 0.52 cm² (Figure 6). To evaluate the effect of one-sided exposure, the surface area was adjusted to 0.26 cm² (Figure 7).
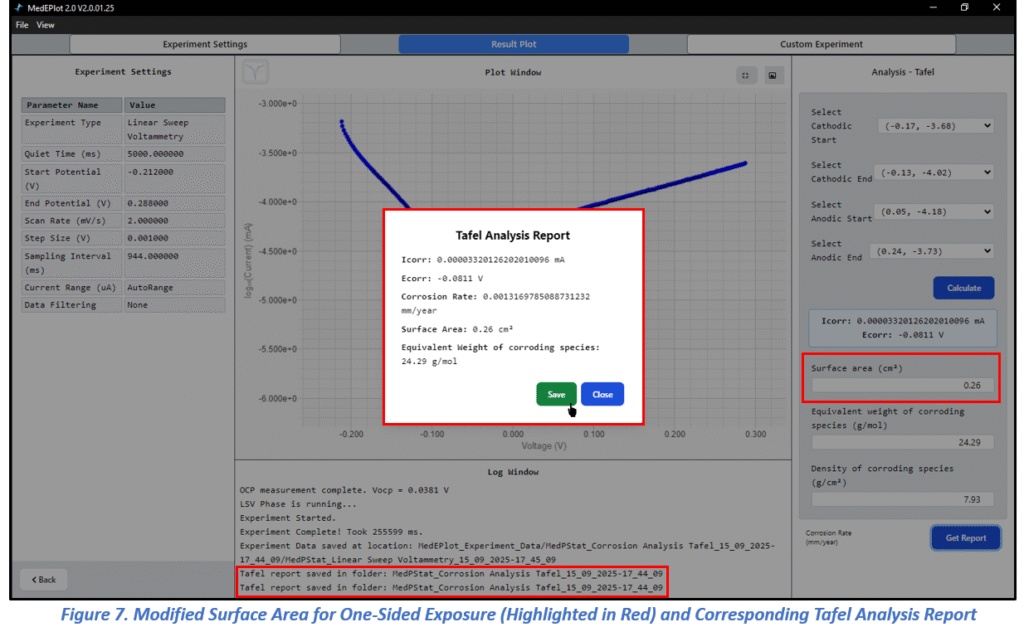
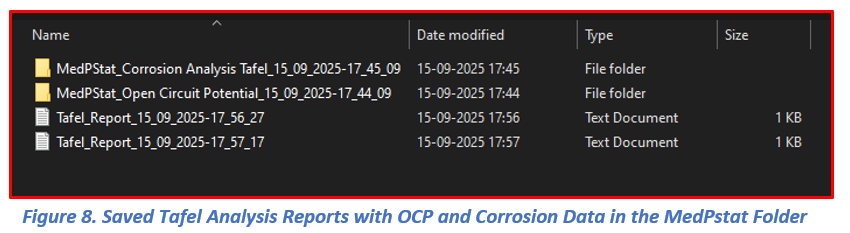
After updating the parameter, the Get Report function was used again to generate a new report, which was then saved. All saved reports can be accessed anytime through File Explorer → Documents → MedPstat Experimental Data → Tafel_Report (Figure 8). The software supports storing up to ten reports in the Tafel Analysis folder, ensuring data traceability and enabling users to perform repeated calculations for predictive or comparative corrosion studies.
Conclusion
The MedPstat 2.0 Electrochemical Workstation provides a comprehensive and user-friendly platform for corrosion studies using Tafel analysis. By automating the key steps from OCP measurement and polarization scanning to branch fitting and corrosion rate calculation, the system ensures accurate, reproducible, and efficient data analysis. The software also allows users to input material-specific parameters, such as surface area, density, and equivalent weight, enabling the precise determination of corrosion rates expressed in practical units. With the added flexibility of saving multiple test reports in .txt format, MedPstat not only simplifies the workflow but also enhances data traceability and post-analysis flexibility. These features make it a powerful solution for both academic research and industrial corrosion evaluation.
Thanks for choosing MedPstat as your research companion.
MTX Labs Team