In this application note, the step-by-step process to calculate the diffusion coefficient (D) for ferro-ferri cyanide redox couple is explained with the help of portable potentiostat MedPstat 2.0. The note explores the effect of scan rate on the voltammetric response of a redox couple, applies the Randles–Sevcik equation to calculate D, and highlights its significance in electrochemical systems, along with alternative methods for D determination.
What You’ll Learn from This Application Note
-
What is the diffusion coefficient, and why is it important in electrochemistry?
-
How can D be calculated using CV and the Randles–Ševčík equation?
-
How does scan rate affect diffusion behavior?
-
What other methods exist to determine D (CA, CC, RDE, EIS, GITT/PITT)?
-
Why is D crucial for batteries, catalysis, and redox studies?
-
If your diffusion coefficient does not match literature values, what could be the reasons?
Introduction:
The diffusion coefficient (D) determines the rate at which electroactive species migrate from the bulk solution to the electrode surface in response to a concentration gradient. In electrochemical systems dominated by mass transport, the diffusion coefficient D strongly affects reaction kinetics, the measured current response, and overall device performance. Precisely determining D is therefore crucial for elucidating redox mechanisms, improving electrode design, and assessing the efficiency of energy storage and conversion systems
Cyclic voltammetry (CV) is a widely used technique for determining diffusion coefficients due to its simplicity, sensitivity, and rapid in-situ capability. By measuring voltammograms at different scan rates and applying the Randles–Sevcik relation, D can be extracted while also providing insight into electron-transfer reversibility, adsorption, and coupled reactions.
Other Methods to determine the diffusion coefficient (D)
- CV – Different scan rates → Randles Sevcik equation (Plots of ip vs. ν1/2)
- CV – Different concentrations → Randles Sevcik equation (Plots of ip vs. C)
- Chronoamperometry → Cottrell equation (Plots of i vs. t–1/2)
- Chronocoulometry → Anson equation (Plots of Q vs. t1/2)
- Rotating Disk Electrode (RDE) → Levich equation (Plots of iL vs. ω1/2)
- EIS → Warburg impedance analysis (Plots of Z′ vs. ω–1/2)
- GITT / PITT → Fick’s law (intermittent titration techniques) plots of E (or i) vs. t1/2
Principle:
The diffusion coefficient D for an electroactive species can be obtained from cyclic voltammetry measurements by applying the Randles–Ševčík relationship, which is valid for reversible redox couples.
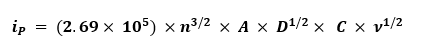
Where:
- 2.69 x 10⁵ – constant
- n – number of electrons transferred
- A – electrode area in cm²
- D – diffusion coefficient in cm²/s
- C – concentration of the electroactive species in mol/cm³
- ν – scan rate in V/s
Rearrange the equation to solve for D:

- S – Slope (Plot iP (y-axis) vs. ν1/2 (x-axis)
Experimental:
Reagents and Apparatus
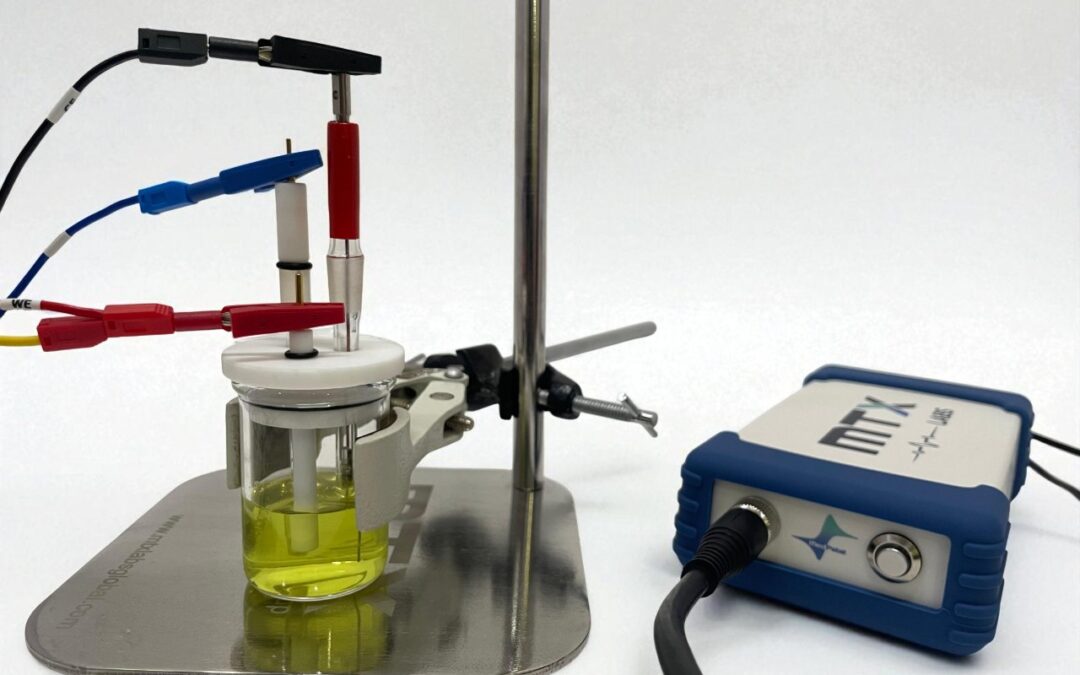
A 30 mL stock solution containing 5 mM K₃[Fe(CN)₆] and 5 mM K₄[Fe(CN)₆] in 1 M KCl was prepared in deionized water. Electrochemical measurements were conducted using a MedPstat 2.0 portable potentiostat (operated via MedEplot software) with a three-electrode MTX Labs mini Gas-Tight Cell. The working electrode was a 3 mm Glassy Carbon electrode, the counter electrode a Platinum Wire, and the reference electrode a Mini Ag/AgCl electrode. Electrode connections to the potentiostat followed the scheme: working electrode (WE) – red, reference electrode (RE) – blue, counter electrode (CE) – black, and sensing electrode (SE) – red.
Before the experiment, all electrodes and the voltammetry cell were thoroughly rinsed with deionized (DI) water. The glassy carbon electrode (GCE) was polished with 0.05 µm alumina powder, followed by DI water rinsing to ensure a clean and active surface.

Result and Discussion:
Cyclic voltammetry (CV) experiments were conducted to investigate the electrochemical behavior of the ferri/ferrocyanide redox couple using a glassy carbon electrode (GCE) in a 1 M aqueous KCl electrolyte. Initial CV measurements were performed at a scan rate of 50 mV/s, scanning from 0.0 V to +0.65 V in the forward (anodic) direction and returning to −0.10 V in the reverse (cathodic) direction. During the anodic sweep, the oxidation current peaked at the anodic peak current (ipa) with a corresponding anodic peak potential (Epa). Similarly, in the cathodic sweep, the reduction current reached its maximum at the cathodic peak current (ipc) and cathodic peak potential (Epc). A representative CV profile is illustrated in Figure 1.
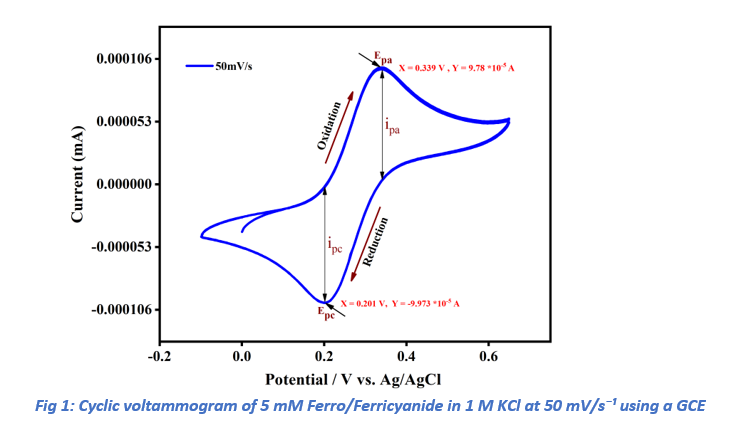
As anticipated, both ipa and ipc increased proportionally with the scan rate, consistent with diffusion-controlled electrochemical processes. The ratio of ipa to ipc remained approximately unity across all scan rates, confirming the reversible nature of the potassium ferricyanide redox reaction. At a scan rate of 50 mV/s, the peak-to-peak separation (ΔEp = Epa − Epc) was calculated as 0.137 V (Epa = 0.338 V, Epc = 0.201 V). This value exceeds the theoretical ΔEp of 0.059 V expected for a one-electron, diffusion-controlled process at 298 K, likely due to limitations in electron transfer kinetics and uncompensated solution resistance.
Determination of the Diffusion Coefficient (D):
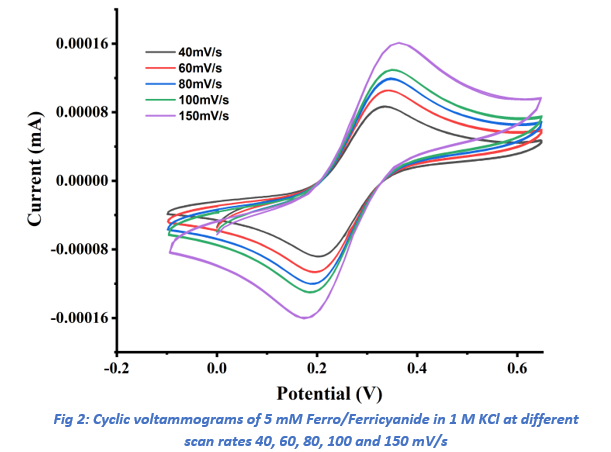
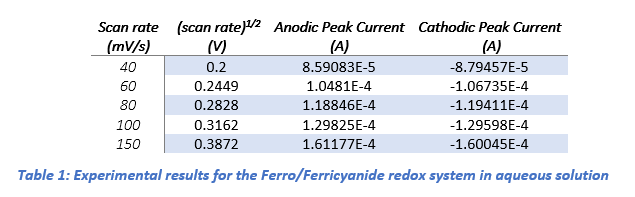
Further CV experiments were conducted at scan rates of 40, 60, 80, 100, and 150 mV/s (Ref Fig 2). The diffusion coefficients (D) for the ferri/ferrocyanide redox couple were determined by plotting the anodic (ipa) and cathodic (ipc) peak currents against the square root of the scan rate (ν(1/2)) using Origin software (Ref fig 3).
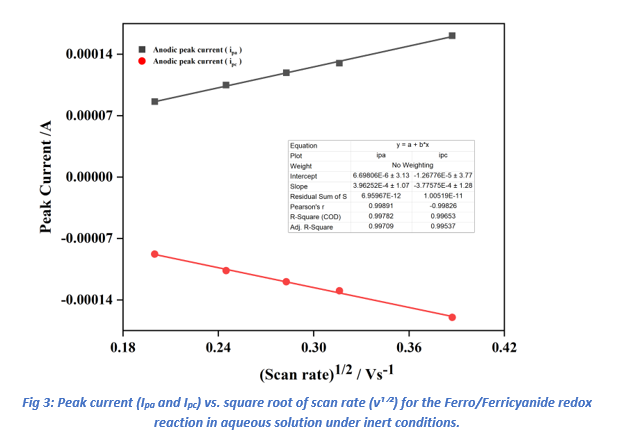
The linear relationships observed in these plots (Table 1) confirmed diffusion-controlled behavior.
Applying the Randles-Sevcik equation (Equation 1), the diffusion coefficients were calculated as 1.74×10⁻⁵ cm2 s−1 for ipa and 1.58×10⁻⁵ cm2 s−1 for ipc. These values are significantly greater than the literature-reported diffusion coefficient of 7.63 × 10⁻⁶ cm²/s for the Ferri/FerroCyanide redox couple, This small difference could be due to several factors: the glassy carbon electrode may have a slightly larger effective surface area because of polishing or surface texture, the experiment might have been performed at a temperature above 25 °C (which speeds up molecular movement), or there may have been tiny fluid movements in the solution that enhanced mass transport.
Conclusion
Cyclic voltammetry of the Ferri/Ferrocyanide redox couple on a glassy carbon electrode in 1 M KCl confirmed a reversible, diffusion-controlled electron transfer process, as evidenced by the linear dependence of peak currents on the square root of the scan rate (ν1/2). The peak-to-peak separation exceeded the theoretical value for a one-electron reversible system, which is likely due to factors such as increased effective electrode surface area from polishing, slight temperature variations and small fluid movements in the solution. All data acquisition and analysis were carried out using Medpstat 2.0, whose high-precision current and potential measurements, combined with integrated Randles–Sevcik analysis, enabled accurate slope fitting and reliable determination of the diffusion coefficient.