
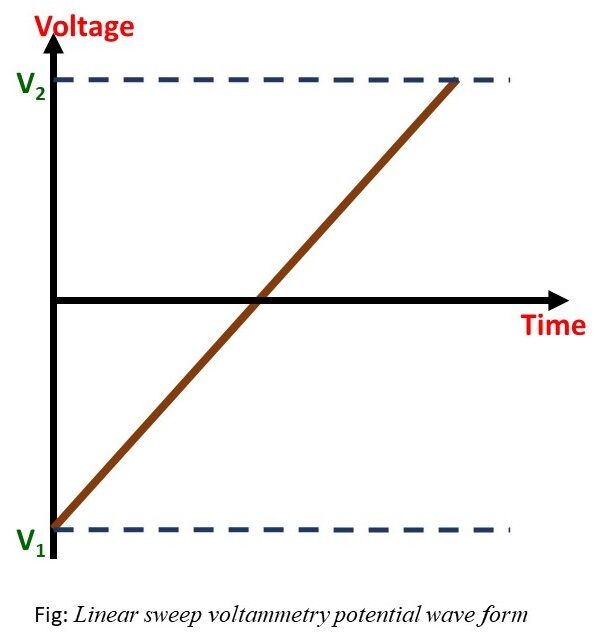
Linear sweep voltammetry is a valuable characterization technique for establishing the redox potential boundaries of an analyte.
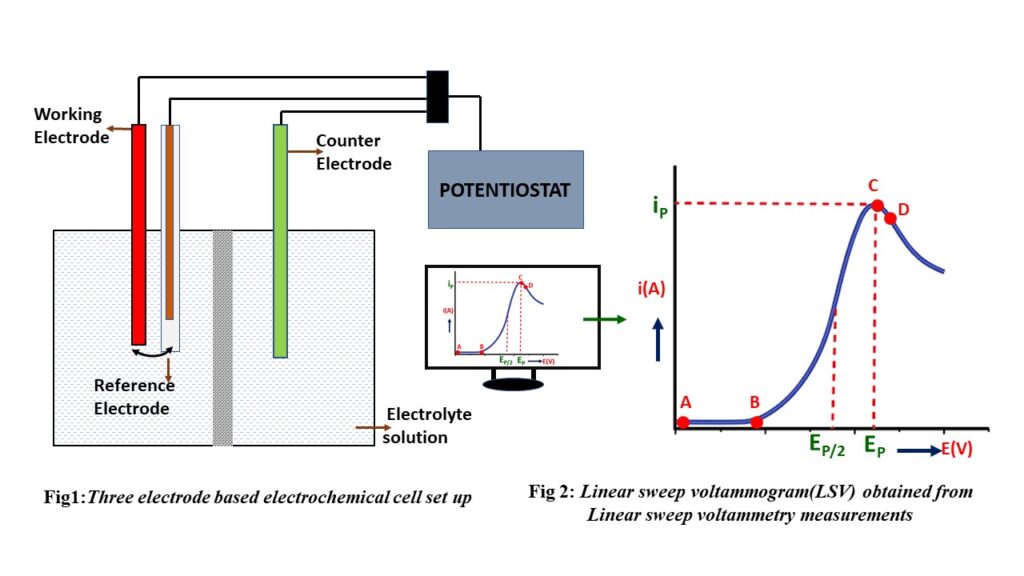
Linear sweep voltammetry employs a three-electrode setup comprising a working electrode, a counter electrode, and a reference electrode. These electrodes are connected to a potentiostat and immersed in an electrochemical cell containing the target solution. The potentiostat precisely controls the voltage difference between the working and reference electrodes while simultaneously monitoring the electrical current passing between the working and counter electrodes. This enables the creation of a potential vs. current plot, revealing the electrochemical behavior, whether it involves oxidation or reduction, of the substance under investigation. Notably, distinctive peaks or dips occur at the points where oxidation or reduction processes commence.
Parameters to run the linear sweep voltammetry:
- Start/stop potential: The “start/stop potential” in Linear sweep voltammetry specifies the initial and final voltage limits of the experiment.
- Scan rate(V/s): The speed of the potential sweep during data acquisition.
Journey of Linear sweep voltammogram:
A (non-faradaic current):
This point in a voltammogram [Fig:3] represents the initial potential where electrochemical reactions are yet to begin and where no current is observed.
B (Onset Potential):
- The point in a voltammogram where the current starts to significantly increase is often referred to as the “Onset Potential” (EOnset). [Fig 3]
- The reaction starts and keeps on flowing electrons until it reaches a specific area of the voltammogram where the current shows exponential growth.
C (Peak):
This point represents the highest current response observed during the oxidation/reduction of a substance at the working electrode.
D (Diffusion layer):
Beyond this point, the electrode’s supply of available redox species becomes limited, causing a reduction in the reaction rate and consequently leading to a decrease in current.
The features observed in a linear sweep voltammogram are influenced by various factors, including:
- Rate of Electron Transfer Reaction(s)
- Chemical Reactivity of the Electroactive Species
- Voltage Scan Rate
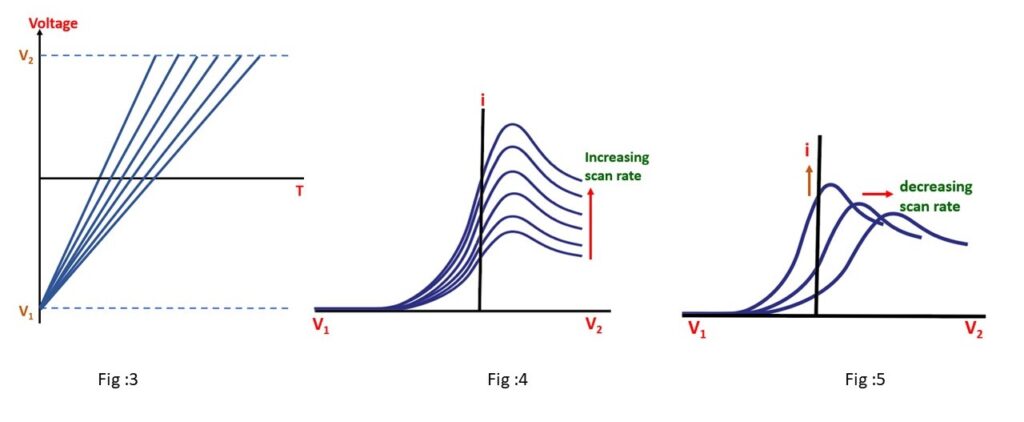
Voltammogram recorded at a single scan rate shows current response variation with scan rate changes.
- Series of linear sweep voltammograms at different rates.
- Total current increases with higher scan rates; attributed to diffusion layer size and scan time (Fig:4).
- Slow scans result in a larger diffusion layer, reducing flux to the electrode, leading to lower current (Fig:5).
- Voltage scan rate impacts behavior in LSV; no explicit time axis but time affects results.
- Rapid processes with swift electron transfers termed reversible electron transfer reactions.
- Electron transfer processes considered ‘slow’ relative to voltage scan rate lead to quasi-reversible or irreversible reactions.
Conclusion:
In conclusion, linear sweep voltammetry is a fundamental technique for establishing the redox potential boundaries of analytes. Utilizing a three-electrode system and controlled voltage sweeps provides insights into electrochemical behavior, identifying oxidation and reduction points. The observed features in voltammograms are influenced by factors like electron transfer rates, chemical reactivity, and voltage scan rate.