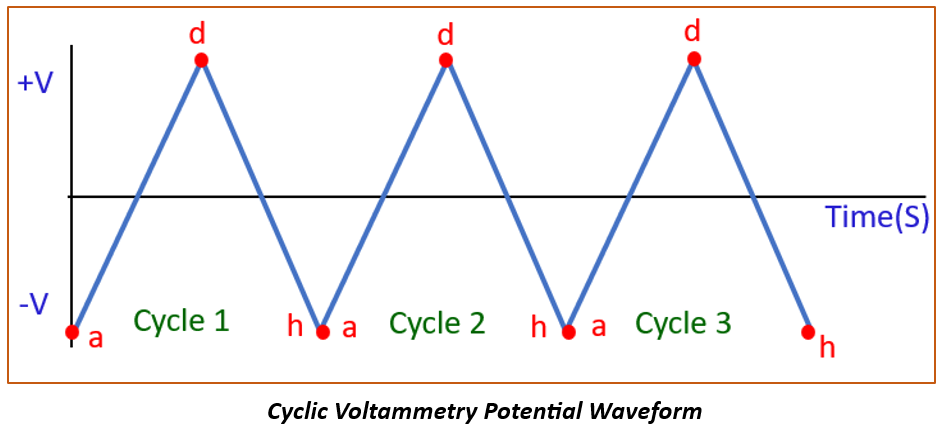
Cyclic voltammetry is a technique that provides valuable information about the electrochemical behavior of a material or a substance through redox reactions in the presence of systematically varied applied voltage/potential.

The principle of cyclic voltammetry involves sweeping the voltage applied to an electrochemical cell back and forth between two limits while measuring the resulting electric current due to redox reactions happening at the surface of the working electrode. Cyclic Voltammetry provides information such as oxidation and reduction potentials, the number of electrons involved in the redox reactions and the reaction kinetics.
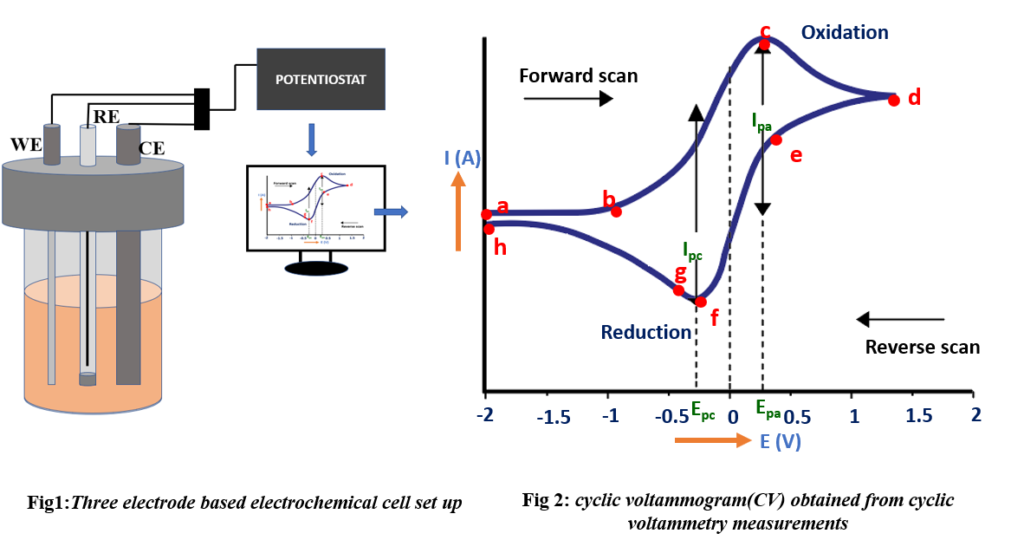
A three-electrode system comprising working electrode (WE), reference electrode (RE), and counter electrode (CE) is typically used for cyclic voltammetry measurements. The electrodes are immersed in an electrolyte solution which is then connected to a potentiostat [Fig 1]. The WE and CE is generally placed on opposite sides of the cell, and the RE should is placed as close as possible to the WE to minimize the ohmic drop. The resulting plot for Cyclic Voltammetry measurements is known as known as a cyclic voltammogram (CV) [Fig 2], illustrating resulting current response due to variations in potential.

Parameters to run the Cyclic Voltammetry (CV) experiment:
- Start/stop potential: The “start/stop potential” in cyclic voltammetry specifies the initial and final voltage limits of the experiment.
- Number of cycles (3): The “number of cycles” refers to the count of times a cyclic voltammogram curve intersects the baseline.
- Step potential: The “step potential” in the CV staircase command is the defined voltage increment, which can be either positive (starting from the start potential towards the upper vertex potential) or negative (reversing the scan direction).
- Scan rate(V/s): Scan rate refers to the speed at which the potential (voltage) is swept between its upper and lower limits, affecting the rate at which electrochemical reactions occur during the measurement.
Cyclic voltammogram (CV):
The cyclic voltammogram exhibits distinct phases, labeled as a, b, c, d, e, f, g, and h, [Fig 2] each representing specific stages in the electrochemical process. Now, let’s proceed to explain these phases.
a (capacitive region):
At the start of the experiment, the current is minimal as the electrodes exhibit capacitive behavior, resulting in very low initial current.
b (potential onset):
The point in a cyclic voltammogram where the current starts to significantly increase is often referred to as the “Onset Potential” (Eonset).
- At the onset, a critical event occurs when electrons attain sufficient energy, enabling them to actively participate in the redox reaction.
- Once the reaction initiates, it continuously generates or consumes electrons, leading to a distinctive region of the voltammogram where the current demonstrates exponential growth.
c (anodic peak):
The anodic peak in an experiment represents the highest current response observed during the oxidation of a substance at the surface of the working electrode (WE).
c-d(curve):
When the voltage is increased, and the current decreases, this behavior represents a clear departure from Ohmic characteristics. According to Ohm’s law, an increase in voltage should result in a corresponding increase in current, but in the realm of electrochemistry, this non-Ohmic behavior is common and indicative of the unique electrochemical nature of the system.
- The electrode possesses a fixed area, allowing close proximity molecules to readily participate in the reaction. However, once the initial reaction is completed, subsequent molecules must undergo the slower process of diffusion to reach and interact with the electrode. In this specific region, the diffusion process lags behind the reaction rate. Consequently, the system attempts to catalyze additional reactions, but there is an insufficient supply of reactants available at the working electrode, resulting in a decline in current.
d (reverse scan):
During the reverse scanning phase, oxidation continues to occur because the applied voltage remains sufficient to sustain the reaction.
e (reactivation peak):
The reverse reaction is reactivated, resulting in a rapid and significant change in the current direction. As the voltage polarity is reversed during the negative scan, the current likewise reverses its direction, quickly surging and reaching its peak once again.
f (cathodic peak):
The “cathodic peak” represents the maximum current response observed during the reduction of a substance at the working electrode.
g (transition point)
Beyond this point, the electrode’s supply of available oxidized species (OX) becomes limited, causing a reduction in the reaction rate and consequently leading to a decrease in current.

